Homepage Research Patents Academic Activities Contact me
The Evaluation And Prediction Of Human Fatigue Based On Pulse Wave Signal
Introduction
In recent years, mental fatigue has already become one of the most significant causes of accidents throughout the modern society. There has been an increasing interest in mental fatigue sensing and evaluation technology, with the widespread hope that such technology can be practically used to prevent mental fatigue related accidents.
In our previous investigation, it has been widely reported that fatigue has relationship with heart rate variability (HRV), especially for those patients with some specific diseases such as Hand-Arm Vibration Syndrome. But according to our investigation, previous researches just stop in the rough conclusion that HRV can reflect fatigue, without any further information about how exactly HRV is related to fatigue. So, the strong curiosity to figure it out finally leads me to carry out this project.
The goal of this project is to quantitatively evaluate the degree of fatigue by processing and analyzing wrist pulse signals. We intended to build a relationship between pulse rate variability (PRV) and scales of fatigue. The reason why we use PRV rather than HRV is that wrist pulse indeed has some relationship with the heart palmus, however is usually easier to be measured and therefore is more promising to be used practically on an integrated portal device.
The whole project has last for a whole year and finally we got a not-so-appealing outcome: Though for some subjects, the higher level fatigue, the more integration of PRV is obtained, there are still a record number of exceptions. We totally get 88 sets of data, but finally only 61 of them roughly match with our expectations. So, finally a conclusion was drawed that PRV do have relationship with fatigue: generally speaking, the higher level fatigue a person gets in, the more integration of PRV is likely to be. However, rather than a strict law, this conclusion does have lots of exceptions, the reason of which may need further exploration.
Project Procedure

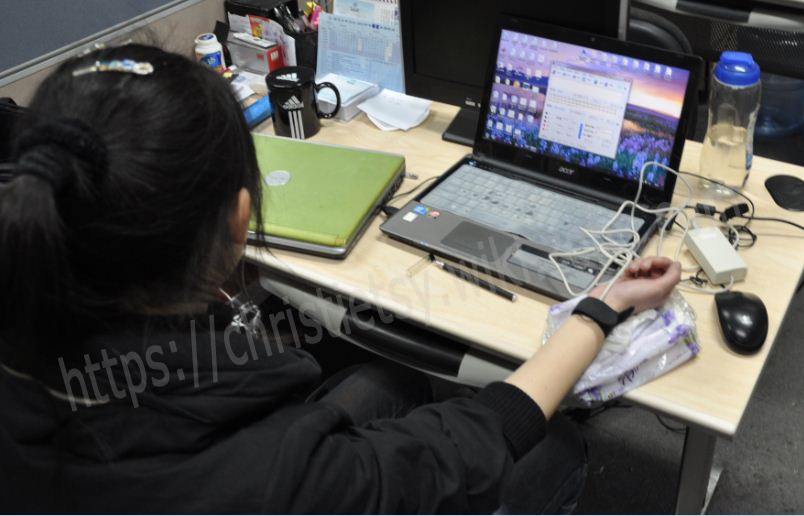
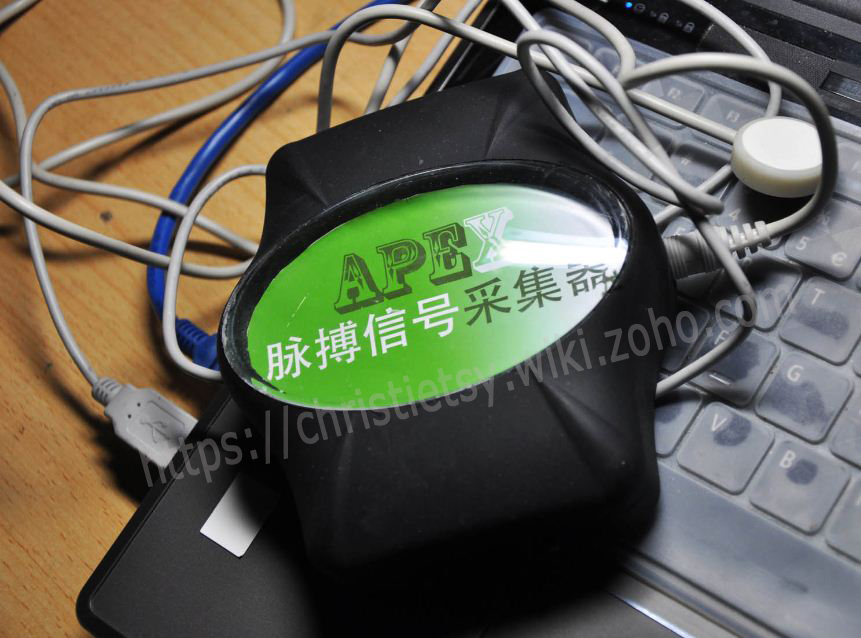
Fig 1 signal collecting Fig 2 Experimentation Fig 3 Integrated Product
The project is carried by the following procedures:
- Pulse Signal Sampling: We use PVDF piezoelectric material as sensor, integrating it with processing circuit to filter, enlarge and digitalize the original pulse signal so that the slight pumping of the pulse can be displayed visually.
- Signal Processing: The processed pulse signal can be transmitted to computers for further analysis throw virtual USB serial port. We use Labview and Matlab integrated programming to create a software for displaying the pulse signal graphics, storing pulse data flow and final analysis.
- Experimentation: Using the above two procedures, we take pulse signals from different subjects (mainly college students) of variant physical situations. Our criteria for the level of fatigue is defined based on both rationality and mentality. We define students aged 20-21 (11 males and 10 females) as our major subjects. Before each sampling, we ask them to fill out an fatigue evaluation form, the questions in which is made according to psychological definitions. Moreover, their level of fatigue has to meet the following standard:
Mental Conditions | Level of Fatigue |
good night sleep and no mental exercise occurred | normal |
one day's study (or other mental exercises) | medium |
one day'smental exercise and stay up all night | extreme |
We intrigue the subjects to willingly achieve the above standard. Then we usually sample their pulse signal for 5mins without major disturbances while having them filling out our fatigue evaluation form simultaneously. Our experiments range widely because we not only sample pulse signal from the same person consecutively for vertical comparison, but also compare signals of different individuals for horizontally comparison just so we can get a more general result.
4. Analysis Algorithm:
Digital data filtering: After sufficient sampling, we manually cut out the period of pulse signal, where operational error is introduced. Then we use Butterworth filter to smooth the signal.
Finding characteristic points: We set the original period of according to an experienced value and a threshold value as half of the difference between the maximum and minimum value of the input pulse signal. Then we began a search process for the extreme points in the next period by comparing each value with its prior one. If the difference is positive, meaning that the pulse wave is on a rising edge, then we place the original maximum value with the new one until the difference between the maximum value and the minimum value is larger than the threshold value and the difference between the current maximum value and the upcoming point is negative, meaning the wave is on a falling edge. After each refresh of extreme value, the threshold value and the period is dynamic altered as the mean of the detected periods. In this way, we are able to find all the maximum and minimum value in a set of data.
Calculating Pulse Rate Variation(PRV) Signal: By calculating the difference between two neighbor extreme value, we are able to get the periods of each pulse wave. Then we calculate the multiplicative inverse of the period data to get the frequency of pulse signal. The variation in frequency are indicators of the variation of pulse rate signals.
Calculating Integral of PRV: Finally we calculate the integral of the PRV signal to see the degree of variation and compare such variation to the level of fatigue of the subject.
Generating Result: By cross-referencing data of different people, we crudely come up with a generalized standard for evaluating the level of fatigue for people aged 15-25. As the result shown, the level of fatigue is quite correspondent to the variations in PRV signals, however, exact the parameter are yet to be reached.
5. Integration of research result: After multiple trials and errors, by combining our pulse signal sensor with analyzing software, our research result can eventually reach 70% of accuracy.
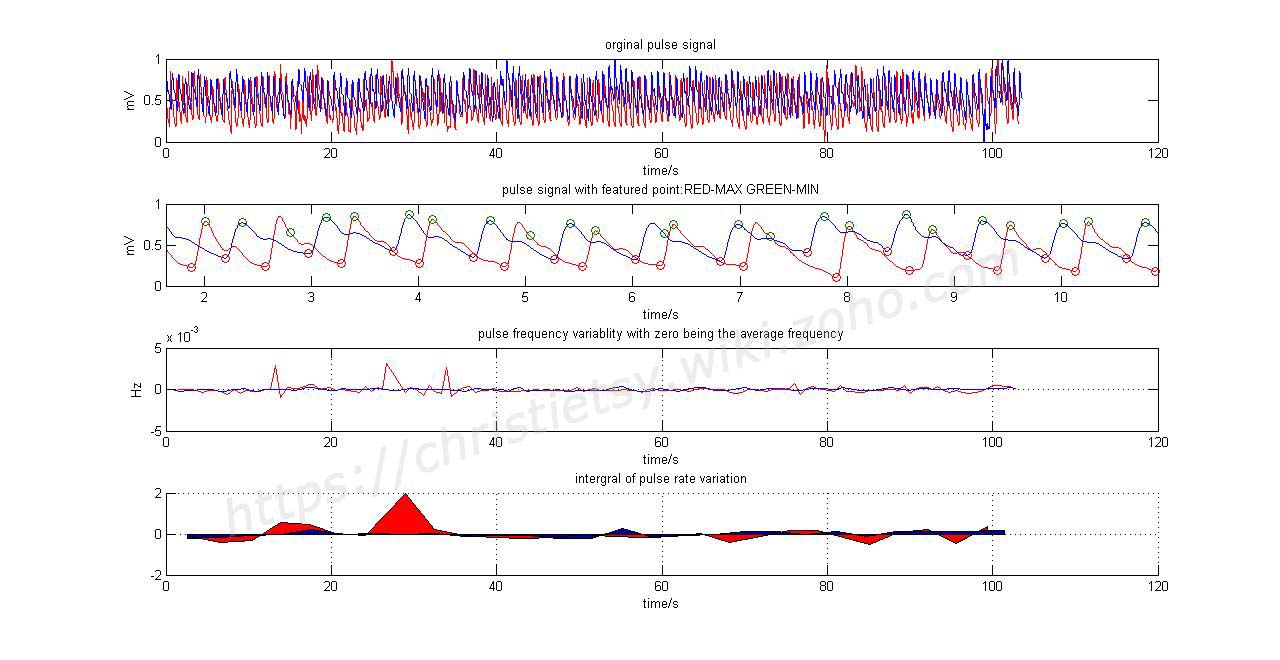
Fig 4 Result: Red represent extreme fatigue and blue represent normal, the variation of red is much bigger than blue
My role in the project
This project is my first completely independent research project. Our team is consist of 3 people from Control Science and Engineering, Biomedical Engineering and Signal Communication Engineering. As the leader of this team, I undertake the responsibility of managing inter-disciplinary cooperation as well as major algorithm development. The theme of the project is defined by ourselves. Though there are many potential undetermined factors such as prediction of possible results, research schedule and experimental methods. However I did manage to lead my team through the whole process and strive to find our own way until a satisfying result, though not completely accurate, is attained. Through this project I learned:
Data mining and algorithm development: the complete set of algorithm is developed by myself. From reading papers to final programming, my ability of algorithm developmeng and finding information through vast data set have been greatly improved.
Management ability: Since our project have a one-year time limit, we have to really focus on finding results. I manage to motivate my team for achieving optimum cooperation and strong perseverance to eventually reaching excellence in the project.
The ability of conducting human-subject research: When doing human-subject researches, much more considerations need to be considered: safety,factor, privacy factor, respect factor, etc.
The ability of raising a funding: To raise a funding for this project, I, with my teammate, altogether have made more than 10 presentations, varying from academic funding, clinical funding to enterprise funding. Finally, we successfully made a funding of ¥40000 which is an amazing number for we undergraduates.
Innovations and Difficulties
1. A research aims to quantitatively evaluate the degree of fatigue.
In this project, we quantitatively divided three levels of fatigue. And finally we achieved a match rate of 70%.
Difficulties:
1) To exactly find each peak/crest of the wrist pulse wave
2) Setting of criteria (threshold) to distinguish each level of fatigue
3) Pattern match between certain level of fatigue and PRV pattern
2. Integration of the sensing system into a portable device
In this project, we successfully apply our theory into a device, though the accuracy is very limited.
Difficulties:
1) The ergonomic design of the shape of our device
2) The design of sensor part that attach the user’s wrist
 Uploading ....